Week 4, 2/1-2/5:
1.(Table and graph) Use the transistor
by itself. The goal is to create the graph for IC
(y axis) versus VBE (x axis). Connect base and collector. Use 10K potentiometer
to generate the voltage. Use 5 V but DO NOT EXCEED 1 V for VBE. Make sure you have the required
voltage value set before applying it to the base. Transistor might get really
hot. Do not TOUCH THE TRANSISTOR! Make sure to get enough data points to graph.
(Suggestion: measure for VBE
= 0V, 0.5V, and 1V and fill the gaps if necessary by taking extra
measurements).
The table above contains the voltage values for BE and current for C.
2. (Table and graph) Create the graph
for IC (y
axis) versus VCE
(x axis). Vary VCE from 0 V to 5 V. Do this measurement for 3 different VBE values:
0V, 0.7V, and 0.8V.
This chart is when Vce is at nearly 1V.
The table above contains our results from measuring the voltages and currents of the transistor.
 |
| This was the circuit given for us to build. |
 |
| Pictured above is the circuit that we built. |
Vbe (V)
|
Ic (mA)
|
0
|
0
|
.518
|
.0035
|
.652
|
2.22
|
.707
|
31.78
|
.962
|
119.50
|
 |
| This line graph displays our data. |
 |
| The picture above is what the circuit should look like. |
 |
| The picture above is the circuit that we built. |
Vce (V)
|
Vbe (V)
|
Ic (mA)
|
.985
|
0
|
0
|
.985
|
.707
|
2.9
|
.985
|
.795
|
39.2
|
Vce (V)
|
Vbe (V)
|
Ic (mA)
|
3.05
|
0
|
0
|
3.05
|
.702
|
3.3
|
3.05
|
.795
|
73.9
|
This chart is when Vce is at nearly 3V.
Vce (V)
|
Vbe (V)
|
Ic (mA)
|
4.98
|
0
|
0
|
4.98
|
.695
|
5.7
|
4.98
|
.796
|
198.5
|
This chart is when Vce is at nearly 5V.
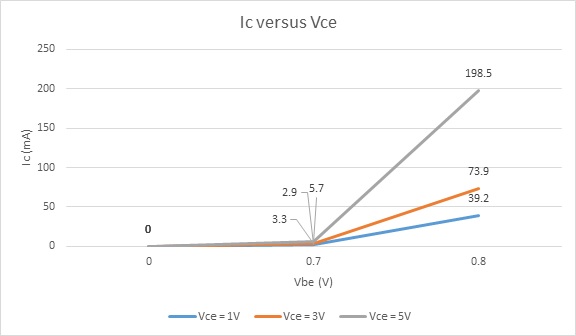 |
| This graph compares Ic versus the different values of Vce. |
3. (Table) Apply the following bias
voltages and fill out the table. How is IC and IB
related? Does your data support your theory?
Ic and Ib are related by beta. Beta is calculated by dividing Ic by Ib.Our data supports the theory because as IC increases, IB increased by a nearly proportional amount
Ic and Ib are related by beta. Beta is calculated by dividing Ic by Ib.Our data supports the theory because as IC increases, IB increased by a nearly proportional amount
VBE (V)
|
VCE (V)
|
IC (mA)
|
IB (mA)
|
.710
|
2.00
|
5.26
|
.034
|
.753
|
2.00
|
15.6
|
.106
|
.796
|
2.00
|
50.26
|
.364
|
4. (Table) Explain photocell outputs
with different light settings. Create a table for the light conditions and
photocell resistance.
The photocell increases in resistance as light decreases. The more light that is on the photocell the more resistance the photocell will provide. The less light, the less resistance. A table of our observations is below. For limited light we covered the cell. For normal light we did not change the light. For increased light we used a flashlight on the cell.
The table above contains our measurements for resistance on the photocell.
The photocell increases in resistance as light decreases. The more light that is on the photocell the more resistance the photocell will provide. The less light, the less resistance. A table of our observations is below. For limited light we covered the cell. For normal light we did not change the light. For increased light we used a flashlight on the cell.
Status
|
Resistance (kilo ohms)
|
Limited light
|
11.5
|
Normal light
|
2.56
|
Increased light
|
.370
|
5. (Table) Apply voltage (0 to 5 V
with 1 V steps) to DC motor directly and measure the current using the DMM.
The table above contains our measurements for voltage and current applied directly to the DC motor.
Voltage (V)
|
Current (mA)
|
0
|
0
|
.97
|
25.9
|
2.06
|
33.3
|
2.95
|
38.7
|
4.07
|
45.3
|
4.95
|
49.7
|
6. Apply 2 V to the DC motor and
measure the current. Repeat this by increasing the load on the DC motor.
Slightly pinching the shaft would do the trick.
A table below shows our data from measuring the motor. 2.06 V were applied for the test. Our load was slightly pinching the shaft of the motor.
The table above contains our observed current values when changing the load on the motor.
A table below shows our data from measuring the motor. 2.06 V were applied for the test. Our load was slightly pinching the shaft of the motor.
Status
|
Current (mA)
|
No Load
|
33.4
|
With Load
|
85.3
|
7. (Video) Create the circuit below (same circuit from week 1). Explain the operation in detail.
when we covered the photo sensor, the value of it is big. Because of voltage divide, the voltage across resistor (R6=1k) is really small. So Ib small lead the current go through the DC motor small. In this conditon, motor goes slowly. when we light the photo sensor, the voltage of R6 increased. Ib increased cause Ic increased. Motor turns faster.
when we covered the photo sensor, the value of it is big. Because of voltage divide, the voltage across resistor (R6=1k) is really small. So Ib small lead the current go through the DC motor small. In this conditon, motor goes slowly. when we light the photo sensor, the voltage of R6 increased. Ib increased cause Ic increased. Motor turns faster.
 |
| This is the circuit that we had to construct. |
The video above describes the circuit that we constructed.
8. Explain R4’s
role by changing its value to a smaller and bigger resistors and observing the
voltage and the current at the collector of the transistor.
R4 limits the amount of current the motor gets. With a stronger resistor the motor will turn at a slower rate. With a smaller resistor the motor will turn faster. A table of our observations is below. Actually, when we short R4 is unreasonable, it might burn the transistor. However, we could not find a resistance smaller than 47. Two resistance in parallel can create a smaller one but we did not remember at that time.
The table above compares the differences in current and voltage based on resistor size.
R4 limits the amount of current the motor gets. With a stronger resistor the motor will turn at a slower rate. With a smaller resistor the motor will turn faster. A table of our observations is below. Actually, when we short R4 is unreasonable, it might burn the transistor. However, we could not find a resistance smaller than 47. Two resistance in parallel can create a smaller one but we did not remember at that time.
Resistor (Ohms)
|
Voltage (Volts)
|
Current (mA)
|
0 (short circuit)
|
0
|
32.3
|
47 (original size)
|
1.6
|
28.75
|
310
|
9.50
|
24.3
|
9. (Video) Create your own Rube
Goldberg setup.
For our Rube Goldberg set up we will have the motor pull a string attached to a mouse trap. The mouse trap will be dragged into the circuit and will activate to send a ping pong ball flying in a general direction. A video of it is below.
The video above shows our Rube Goldberg machine in action.
Your transistor voltage vs current graph is accurate and easy to read.
ReplyDeleteI enjoy your graph of voltage vs current for question 1. Maybe you should specify in the graph that the voltage is VBE and the current is IC.
ReplyDeleteI'll add that into the graph, great suggestion!
DeleteWe like how you added pictures with your blog, it makes it much easier to understand what you're actually doing. Your graph seems consistent with what the theory predicts. Well done.
ReplyDeleteGood job! The graph of question one looks professional.
ReplyDelete1, 2; no explanation
ReplyDelete2 more data points needed.
Rube Goldberg... Vow! :)
I really like how exciting your Rube Goldberg setup is.
ReplyDeleteThis wins as the best Rube Goldberg setup in my opinion. Good work!
ReplyDeleteLove your Rube Goldberg! The anticipation!
ReplyDeleteYour Rube Goldberg is awesome!
ReplyDelete