Wednesday, April 20, 2016

Week 14
4/18/2016 - 4/22/2016:

1. Video of your RG group setup.

Below is a video of our group RG setup.

Video 1: This is a video our of group RG machine set up.

2. Video of your RG group in action

a. Failed attempt

Below is a video of our RG machine failing. We ran into some issues with the way the dominoes were set up and a mousetrap was being difficult.

Video 2: This is a video of our RG machine experiencing some technical difficulties.

b. Successful attempt

Below is a video of our RG machine working properly. Hopefully it works this smoothly every time!

Video 3: This is a video of our RG machine working as intended.

Sunday, April 17, 2016

Week 13:
4/11/2016 - 4/15/2016

Haowen's RB

1. Provide the updated computer drawing for your individual RG setup.


2.Explain your setup.
First, my partner uses his RB drags a piece of paper so light will trigger photocell. Due to the input voltage is 10V, I use a resistor to divide the voltage which help me get 6V voltage. This 6V can trigger a relay which connect to a 5V power. 5V power can light four 7-segment display and show a word "COOL". Meantime, 555 timer, 74192 and 7447 can light another 7-segment display which will count number from 0 to 9. I use an and gate between 74192 and 7447 and connect it to input B and input C of the 7447. When both of this input have high value, the output of and gate will set into high position. And I connect a motor to this and gate. Through the truth table, when the number showed on the 7-segment is 7 or 8, the motor will spin. The motor ties to a column which holds another weight. When the motor spin and the column dragged by the motor, the weight will drop onto a mouse trip which will drag another paper. This paper cover another photocell. When light trigger this photocell, relay will have a zero output (pin 1 connect to ground) which will lead the and gate always has a low voltage output. So the motor will not spin after the mouse-trap is triggered.

3. Provide photos of the circuit and setup.
Photo of my circuit.

4. Provide at least 2 new videos of your setup in action, one being a failed attempt.


video of a failed attempt


video of a succeed attempt

My RG still needs some modifies because I still need my hand to move light source. However, I do not think this will be a problem since I can find more cellphone or small flashlight next time. 

5. What failures did you have? How did you overcome them? 
The first time I just used a paper rod to trigger the mouse-trap which did not have enough weight and sometimes the rob will fall down to some other sides rather than the central of the mouse-trap. So I attached another weight onto the rod which can trigger the mouse-trap perfectly and used two more paper to build a simple pathway. 

GROUP TASKS

6. Group task: Explain your group RG setup.  
As a group our RG machine starts with Adam's machine and then moves into Haowen's machine. Adam's will have dominoes that will cause a mechanical motion to start Haowens which will trigger a mouse trap to power the next group's machines.
7. Group task: Video of a test run of your group RG
 The video below is a test run of our RG machine. We ran into some technical difficulties on both of the machines. Adam's machine had difficulties pulling the note card in the correct direction and Haowen's machine did not trigger the mousetrap correctly. We will have everything fixed by the time we need to present to the class. 
Video G1: This is a video of our group RG machine in action.


Adam's RG.

1. Provide the updated computer drawing for your individual RG setup.

Picture 1: This is the new circuit diagram for my RG machine.


2.Explain your setup.

My RG machine is activated by a brief amount of pressure applied to my force sensing resistor. This allows the relay to "switch over" from an LED light. The motor will then pull a string attached to a card that is in between an LED and a photocell resistor. After the motor has pulled the card and the force is done being applied to the resistor the relay switches back over and the LED is lit once again. The LED lowers the resistance of the photocell resistor which will then turn on another motor. This second motor will knock over dominoes that will eventually start my partners RG machine and fall in the way of my motor, preventing anymore motion.


3. Provide photos of the circuit and setup.

Picture 2: This is the circuitry of my RG machine

Picture 3: These are the dominoes that will stop my machine and start Haowen's machine.


Picture 4: This is a view of both the circuitry and the dominoes.

Picture 5: This is a wide view of my circuit and Haowen's before we attempted a group trial.


4. Provide at least 2 new videos of your setup in action, one being a failed attempt.

Video 1: This video is a failed attempt of my RG machine.


Video 2: This is a video of my RG machine set up. In this video the dominoes are not yet set up to stop my circuit and to power my partners.


5. What failures did you have? How did you overcome them? 
My failures mainly came from mechanical actions. Setting up the dominoes correctly took a lot of time because they frequently failed or were knocked over prematurely. As well as that, we ran out of string to use for our circuitry so we had to re use string that had already been spun by the motor. Because it was already spun, the string did not pull as predictably as it should have. To overcome these failures I brought in new string to work with and tried different ways to set up the dominoes.

For #6 and #7 please look above my post and beneath Haowen's post.

Monday, April 4, 2016

Week 12: 04/04/2016 - 04/08/2016
Haowen
    1. Provide the computer drawing for your individual RG setup.
Fig.1 Circuit of Haowen's Rb

    2. Explain your setup.
         At first, I used a solar panel as the trigger of my circuit. Through some measurement I found the solar panel would generate a 200mV DC voltage. Then I connected it to an amplifier so that I could control a relay. When the other circuit powered by 5V voltage, four 7-segment display would show a word "COOL". At the same time, 555 timer would generate a clock. Through binary coded decimal counter and display driver, the remain 7-segment display would start counting numbers. I want to use an or gate and a motor at last. The motor would spin when the number is from 4 to 9. Next I would connect this motor to a paper mouse which could trigger a mouse-trap.

    3. Provide photos of the circuit and setup.
Photo.1 Circuit of Haowen's RB
Photo. 2 Voltage generated by solar panel and then amplified by OPAMP

     4. Provide at least 2 videos of your setup in action, one being a failed attempt.


Video 1 Failed attemt

Vedio 2 Part of Haowen's RB


     5.  What failures did you have? How did you overcome them?
           The first time I did not use the relay to control the circuit. I wanted to use the voltage generated by solar panel support the whole circuit. It was easy to get a 5 volts voltage, however, when I connected this voltage to the remain circuit directly, the voltage would decrease into 2 volts. And if I used the power supply to replace this voltage, all things works well.
              So I increased the gain of amplifier and got a 7 volts voltage which I could use to control the relay. When the circuit was working, the power supply would offer the input of the circuit. 


Adam

1. Provide the computer drawing for your individual RG setup.
Picture 1 below is the picture for my individual RG setup.
Picture 1: This is Adam's Rube Goldberg set up.


2. Explain your setup.
My Rube Goldberg machine is a fairly simple set up. I have a voltage source that is going to a pressure sensor and then to a relay switch. When the pressure sensor has enough pressure on it, it will cause the relay switch to change which pin is its output. When this happens the LED light will turn off and the motor will spin. The motor will knock over a series of dominos that will trigger the next Rube Goldberg machine.

3. Provide photos of the circuit and the set up.

Picture 2 shows a photo of my circuit below, however, it is incomplete. I do not yet have the dominoes set up to trigger the next circuit.

Picture 2: This is a setup of my circuit.


4. Provide at least 2 videos of your setup in action, one being a failed attempt.
Videos of my circuit are below. The first one shows a "successful" run of my set up. While I do not have the transitions yet, the circuit is working as is should be. The second video does not work as intended. I did not ground the motor in the second video and so I did not complete the circuit to get voltage.


Video 1: This is my "successful" Rube Goldberg attempt.

5. What failures did you have? How did you overcome them?
I had many failures while working on my circuit. One of them being unable to trigger my circuit. I originally planned for a strain gauge to be used to trigger my circuit but was unable to get a large enough output from it. I also had issues with my circuitry being too complicated. I had to simplify my circuit down from previous ideas because I could not create a circuit that was able to work with the transitions between groups.
5.
What failures did you have? How did you overcome them?

Monday, March 28, 2016

Week 11: 03/28/2016 – 04/02/2016
Blog sheet Week 11: Strain Gauges

Part A: Strain Gauges:

Strain gauges are used to measure the strain or stress levels on the materials. Alternatively, pressure on the strain gauge causes a generated voltage and it can be used as an energy harvester. You will be given either the flapping or tapping type gauge. When you test the circle buzzer type gauge, you will lay it flat on the table and tap on it. If it is the long rectangle one, you will flap the piece to generate voltage.

1.    Connect the oscilloscope probes to the strain gauge. Record the peak voltage values (positive and negative) by flipping/tapping the gauge with low and high pressure. Make sure to set the oscilloscope horizontal and vertical scales appropriately so you can read the values. DO NOT USE the measure tool of the oscilloscope. Adjust your oscilloscope so you can read the values from the screen. Fill out Table 1 and provide photos of the oscilloscope.


Table 1: Strain gauge characteristics
Flipping Strength
Minimum Voltage
Maximum Voltage
Low
-100mV
400mV
High
-1.20V
1.40V
Picture 1: This is the output with a low pressure tap.


Picture 2: This is the output with a high pressure tap


   2. Press the Single button below the Autoscale button on the oscilloscope. This mode will allow you to capture a single change at the output. Adjust your time and amplitude scales so you have the best resolution for your signal when you flip/tap your strain gauge. Provide a photo of the oscilloscope graph.

Picture 3: A single tap of our strain gauge measured.

Part B: Half-Wave Rectifiers


1.    Construct the following half-wave rectifier. Measure the input and the output using the oscilloscope and provide a snapshot of the outputs.


Picture 4: This circuit is for the half wave rectifier.


Picture 5: The input to our half-wave rectifier circuit.

Picture 6: The output to our half-wave rectifier circuit.


2.    Calculate the effective voltage of the input and output and compare the values with the measured ones by completing the following table.

The table below has our calculations for the Half Wave Rectifier circuit. To calculate the input and  we divided the voltage by 2squareroot2. To calculate the output we divided the voltage by squareroot2. Ideally the diode does not use any of the voltage so it is able to be 100% efficient. When we measured the results, we did not have the ideal efficiency.

Table 2: Half Wave Rectifier Voltages 
Effective (rms) Values
Calculated
Measured
Input
3.53V
3.64V
Output
3.53 V
2.99V
   3.  Construct the following circuit and record the output voltage using both DMM and the oscilloscope.


Picture 7: This is the half wave rectifier with a capacitor connected in parallel at the end,

Picture 8: This is a picture of our output voltage from the Oscilloscope.


Table 3: This table displays our readings for the circuit shown in Picture 7.

Oscilloscope
Output Voltage (p-p)
4.08V
Output Voltage (mean)
1.67V


4.   Replace the 1 μF capacitor with 47 μF and repeat the previous step. What has changed?

We did not have a 100 Î¼F capacitor so we had to use a 47 Î¼F capacitor for this part.


Picture 9: The oscilloscope readings of the previous circuit with a larger capacitor.

Table 4: This table displays our readings as shown in Picture 9.

Oscilloscope
Output Voltage (p-p)
320 mV
Output Voltage (mean)
3.11V

Part C: Energy Harvesters

1.    Construct the half-wave rectifier circuit without the resistor but with the 1 μF capacitor. Instead of the function generator, use the strain gauge. Discharge the capacitor every time you start a new measurement. Flip/tap your strain gauge and observe the output voltage. Fill out the table below:

Picture 10: This picture is the real life model of our constructed circuit.


Table 5: This table displays our data for tapping the strain gauge at different frequencies for different amounts of time.
Tap Frequency
Duration
Output Voltage
1 Tap/Second
10 Seconds
390 mV
1 Tap/Second
20 Seconds
650 mV
1 Tap/Second
30 Seconds
1.13 V
4 Tap/Second
10 Seconds
1.65 V
4 Tap/Second
20 Seconds
1.86 V
4 Tap/Second
30 Seconds
2.20 V


2.    Briefly explain your results.

We found that the longer and more frequently that you tap the strain gauge the higher output you have. However, the voltage had a maximum at roughly 2.20 Volts because of the size of the capacitor. Once it reached this voltage it began to discharge and then had to be recharged.
   3. If we do not use the diode in the circuit (i.e. using only strain gauge to charge the capacitor), what would you observe at the output? Why?

When you do not use the diode in the circuit you cannot obtain higher voltage levels. Without the diode the electricity will be in AC and not DC and there will be a negative part to the wave that will not allow as large of an output. A photo of out results is below.


Picture 11: This is the output when there is no diode in the circuit.

Monday, March 21, 2016

Week 10: 3/21/2016 – 3/25/2016

Blogsheet week 10

In this week’s lab, you will collect more data on low pass and high pass filters and process them using MATLAB.

PART A: MATLAB practice.

1.    Open MATLAB. Open the editor and copy paste the following code. Name your code as FirstCode.m Save the resulting plot as a JPEG image and put it here.
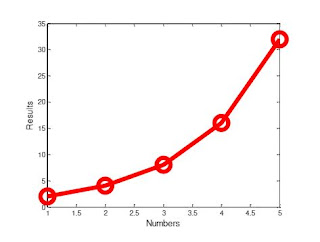
Our results are plotted below as graph 1.

clear all;
close all;
x = [1 2 3 4 5];
y = 2.^x;
plot(x, y, 'LineWidth', 6)
xlabel('Numbers', 'FontSize', 12)
ylabel('Results', 'FontSize', 12)

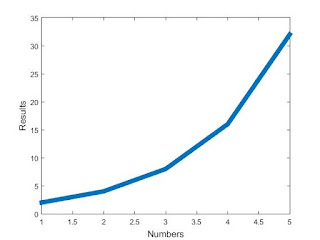
Graph 1: This is the plot to the code above.


2.    What does clear all do?
Clear all removes all variables from the current work space

3.    What does close all do?

Close all closes all figures in the current work space

4.    In the command line, type x and press enter. This is a matrix. How many rows and columns are there in the matrix?

There are 5 columns and 1 row in the matrix. A picture is below.
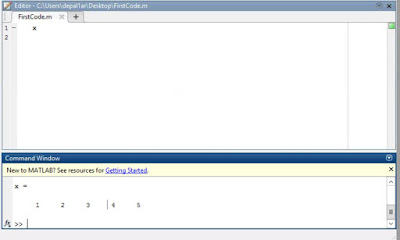
Picture 1: This is a picture of what happens when you run X in the command line.


5.    Why is there a semicolon at the end of the line of x and y?
There is a semicolon to suppress the command. It prevents MATLAB from plotting the matrix x = [1 2 3 4 5]

6.    Remove the dot on the y = 2.^x; line and execute the code again. What does the error message mean?

We got the error in the picture below. If you remove the dot X is not a matrix anymore and due to setting X as a matrix previously in the code it causes an error.


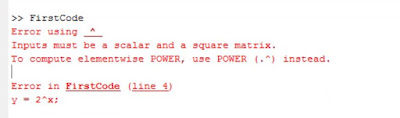
Picture 2: This is a picture of the error described in question 6.


7.    How does the LineWidth affect the plot? Explain.

The LineWidth changes how thick the plot is. Below is a picture of the same code from #1 but with 'LineWidth', 10.


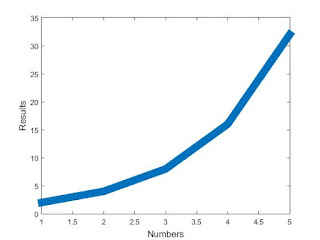
Graph 2: This graph is identical to the one in question one, except that the line is thicker.


8.    Type help plot on the command line and study the options for plot command. Provide how you would change the line for plot command to obtain the following figure (Hint: Like LineWidth, there is another property called MarkerSize)

Graph 3: This is the graph we are supposed to replicate for question 8.
To change the code we adjusted the Linewidth, included MarkerSize, and MarkerEdgeColor. A picture of our code is below.

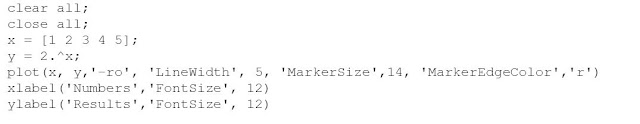
Picture 2: This is our code to make the graph for question 8.


9.    What happens if you change the line for x to x = [1; 2; 3; 4; 5];? Explain.

It creates multiple rows for the matrix. Instead of having 1 row with 5 columns it will have 5 rows with 1 column.

11. Degree vs. radian in MATLAB:

a.    Calculate sinus of 30 degrees using a calculator or internet.

sin(30 degrees) = .5

b.    Type sin(30) in the command line of the MATLAB. Why is this number different? (Hint: MATLAB treats angles as radians).

In MATLAB sin(30) = -0.9880. This number is different because it is the value calculated with 30 radians, not degrees.

c.    How can you modify sin(30) so we get the correct number?

You can change the number from radians to degrees. If you multiply 30 by pi/180 you can get sin(.5235987756) which is equal to .5. Another way to get the correct number is modify sin(30) into sind(30).

12.  Plot y = 10 sin (100 t) using Matlab with two different resolutions on the same plot: 10 points per period and 1000 points per period. The plot needs to show only two periods. Commands you might need to use are linspace, plot, hold on, legend, xlabel, and ylabel. Provide 
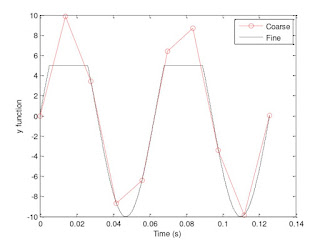
your code and resulting figure. The output figure should look like the following:
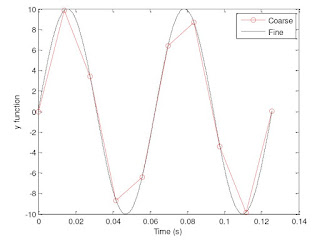
Graph 4: This is the graph we are supposed to replicate for question 12.

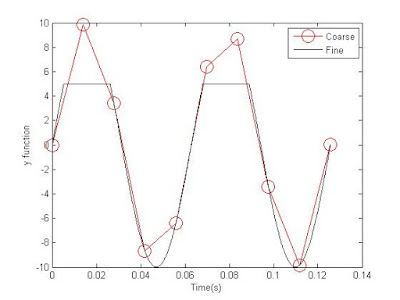
Our output and code are below:
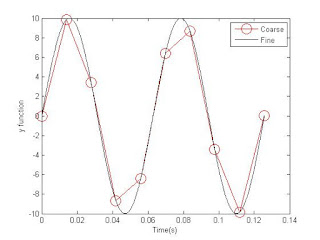
Graph 5: This graph is our result in trying to replicate Graph 4.


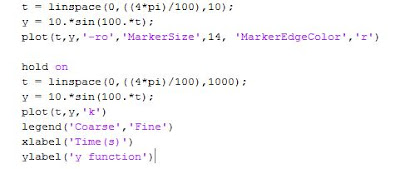
Picture 3: This picture is our code for graph 5.


13.                  Explain what is changed in the following plot comparing to the previous one.
Graph 6: This graph is given and has a cutoff point for the fine line at 5.

The range on the fine function in this plot has been limited to (-10,5). In the plot in number 12 the range of both functions was (-10,10).


14.                  The command find was used to create this code. Study the use of find (help find) and try to replicate the plot above. Provide your code.

Using the find function we were able to create code that replicated this graph. Below is our output and a picture of our code.


Graph 7: This is our replication of graph 6.

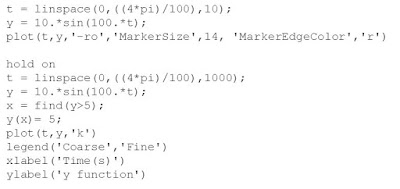
Picture 4: This is our code for graph 7.


PART B: Filters and MATLAB

1.    Build a low pass filter using a resistor and capacitor in which the cut off frequency is 1 kHz. Observe the output signal using the oscilloscope. Collect several data points particularly around the cut off frequency. Provide your data in a table.

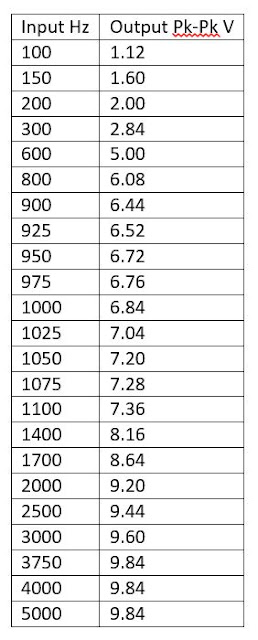
We built the low pass filter, the table below contains our input and output measurements. We used 5 V as our input and read peak to peak voltage.

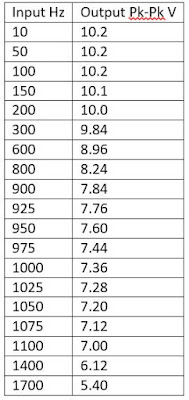
Table 1: This is our data for the low pass filter. Our input voltage is 5V and our output is read in pk-pk voltage.

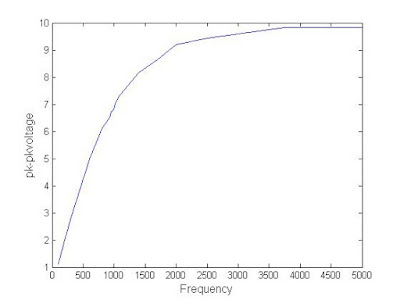
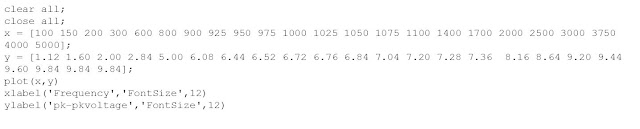
2.    Plot your data using MATLAB. Make sure to use proper labels for the plot and make your plot line and fonts readable. Provide your code and the plot.


Graph 8: This graph is our data from above plotted to show a low pass filter.

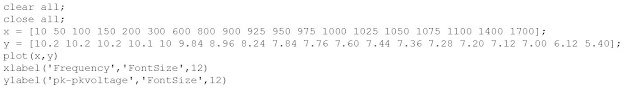
Picture 5: This is our code for the graph above.


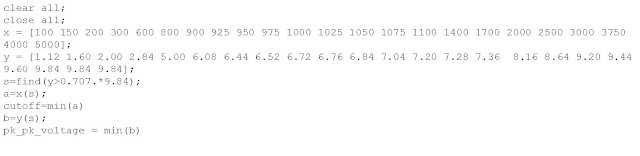
3.    Calculate the cut off frequency using MATLAB. Find command will be used. Provide your code.


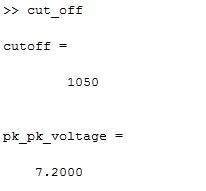
Picture 6: This is our calculated cut off value from MATLAB.

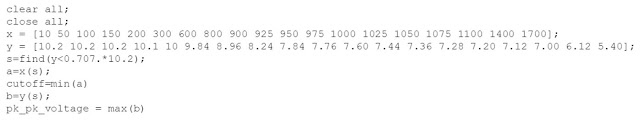
Picture 7: This is the code to calculate our value.


4.    Repeat 1-3 by modifying the circuit to a high pass filter.

A.
Table 2: This is our table for the high pass filter. 

B.
Graph 9: This graph is our data for a high pass filter plotted.

Picture 8: This is our code for the graph above.


C.


Picture 9: This is the calculated cutoff value fromMATLAB.


Picture 10: This is our code for the MATLAB calculation above.