Week 11: 03/28/2016 –
04/02/2016
Blog
sheet Week 11: Strain Gauges
Part A: Strain Gauges:
Strain
gauges are used to measure the strain or stress levels on the materials.
Alternatively, pressure on the strain gauge causes a generated voltage and it
can be used as an energy harvester. You will be given either the flapping or
tapping type gauge. When you test the circle buzzer type gauge, you will lay it
flat on the table and tap on it. If it is the long rectangle one, you will flap
the piece to generate voltage.
1.
Connect the oscilloscope probes to
the strain gauge. Record the peak voltage values (positive and negative) by
flipping/tapping the gauge with low and high pressure. Make sure to set the oscilloscope
horizontal and vertical scales appropriately so you can read the values. DO NOT
USE the measure tool of the oscilloscope. Adjust your oscilloscope so you can
read the values from the screen. Fill out Table 1 and provide photos of the
oscilloscope.
Table
1: Strain gauge characteristics
Flipping Strength
|
Minimum Voltage
|
Maximum Voltage
|
Low
|
-100mV
|
400mV
|
High
|
-1.20V
|
1.40V
|
 |
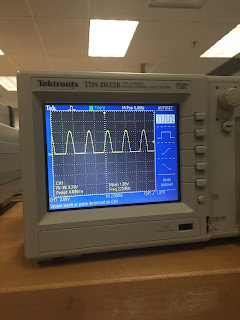
| Picture 1: This is the output with a low pressure tap. |
 |
| Picture 2: This is the output with a high pressure tap |
2. Press the Single button below the
Autoscale button on the oscilloscope. This mode will allow you to capture a
single change at the output. Adjust your time and amplitude scales so you have the
best resolution for your signal when you flip/tap your strain gauge. Provide a
photo of the oscilloscope graph.

Picture 3: A single tap of our strain gauge measured.
Part B: Half-Wave
Rectifiers
1.
Construct the following
half-wave rectifier. Measure the input and the output using the oscilloscope
and provide a snapshot of the outputs.

 |
| Picture 4: This circuit is for the half wave rectifier. |

Picture 5: The input to our half-wave rectifier circuit.

Picture 6: The output to our half-wave rectifier circuit.
2.
Calculate the effective voltage of
the input and output and compare the values with the measured ones by
completing the following table.
The table below has our calculations for the Half Wave Rectifier circuit. To calculate the input and we divided the voltage by 2squareroot2. To calculate the output we divided the voltage by squareroot2. Ideally the diode does not use any of the voltage so it is able to be 100% efficient. When we measured the results, we did not have the ideal efficiency.
Effective (rms) Values
|
Calculated
|
Measured
|
Input
|
3.53V
|
3.64V
|
Output
|
3.53 V
|
2.99V
|
3. Construct the following circuit and record
the output voltage using both DMM and the oscilloscope.
Table 3: This table displays our readings for the circuit shown in Picture 7.
 |
| Picture 7: This is the half wave rectifier with a capacitor connected in parallel at the end, |
 |
| Picture 8: This is a picture of our output voltage from the Oscilloscope. |
Table 3: This table displays our readings for the circuit shown in Picture 7.
Oscilloscope
|
|
Output Voltage (p-p)
|
4.08V
|
Output Voltage (mean)
|
1.67V
|
4. Replace the 1 μF capacitor with 47 μF and repeat the previous step. What has changed?
We did not have a 100 μF capacitor so we had to use a 47 μF capacitor for this part.
We did not have a 100 μF capacitor so we had to use a 47 μF capacitor for this part.
 |
| Picture 9: The oscilloscope readings of the previous circuit with a larger capacitor. |
Table 4: This table displays our readings as shown in Picture 9.
Oscilloscope
|
|
Output Voltage (p-p)
|
320 mV
|
Output Voltage (mean)
|
3.11V
|
Part C: Energy Harvesters
1.
Construct the half-wave rectifier
circuit without the resistor but with the 1 μF capacitor. Instead of the
function generator, use the strain gauge. Discharge the capacitor every time
you start a new measurement. Flip/tap your strain gauge and observe the output
voltage. Fill out the table below:
 |
| Picture 10: This picture is the real life model of our constructed circuit. |
Table 5: This table displays our data for tapping the strain gauge at different frequencies for different amounts of time.
Tap
Frequency
|
Duration
|
Output
Voltage
|
1
Tap/Second
|
10
Seconds
|
390 mV
|
1
Tap/Second
|
20
Seconds
|
650 mV
|
1
Tap/Second
|
30
Seconds
|
1.13 V
|
4
Tap/Second
|
10
Seconds
|
1.65 V
|
4
Tap/Second
|
20
Seconds
|
1.86 V
|
4
Tap/Second
|
30
Seconds
|
2.20 V
|
2.
Briefly explain your results.
We found that the longer and more frequently that you tap the strain gauge the higher output you have. However, the voltage had a maximum at roughly 2.20 Volts because of the size of the capacitor. Once it reached this voltage it began to discharge and then had to be recharged.
We found that the longer and more frequently that you tap the strain gauge the higher output you have. However, the voltage had a maximum at roughly 2.20 Volts because of the size of the capacitor. Once it reached this voltage it began to discharge and then had to be recharged.
3. If we do not use the diode in the
circuit (i.e. using only strain gauge to charge the capacitor), what would you
observe at the output? Why?
When you do not use the diode in the circuit you cannot obtain higher voltage levels. Without the diode the electricity will be in AC and not DC and there will be a negative part to the wave that will not allow as large of an output. A photo of out results is below.
 |
| Picture 11: This is the output when there is no diode in the circuit. |
I like how you included a picture of what the output would be if there is no diode in the circuit. Also, compared to other groups you didn't include the output peak to peak and mean from DMM in Part B. I've seen some groups have done it, so I was wondering why you guys didn't?
ReplyDeleteI thought Dr. Kaya said that we did not need the DMM readings. I'll have to double check with him on Monday though. Good catch!
DeleteEverything looks pretty good! I like that you also uploaded photo of how you construct the circuit of Part C, it will be convenient if you want to recall how to build the circuit later. -Yao
ReplyDeleteHey! Thought your wave-forms all looked pretty sharp! Cool stuff.
ReplyDeleteNick
Hey! Thought your wave-forms all looked pretty sharp! Cool stuff.
ReplyDeleteNick
Very Nice Post this week. All of your wave-forms look sharp and the inclusion of the extra photos really add to the presentation. My only suggestion would be to increase the size of the photos in your blog to "Large or XL" to really make them stand out.
ReplyDeleteI'll change them accordingly. Sometimes whenever I make the photos larger some of the photo is cutoff by the margins on the blog. I'll play with it though to try and make it work.
DeleteI like the blog this week. It seems like you added more picture that what is required, which is a good thing.
ReplyDeleteThank you!
DeleteI like the last picture of what it would look like if the diode was not included in the circuit. You guys included photos that you didn't need to and that helped me understand things more vividly. Thank you! Great blog.
ReplyDeletei like how you included a picture of your set up and what it would look like with out the diode.
ReplyDeleteThank you!
DeleteI like all the pictures you add on, I also like the waves you have for part B3. Those are some smoothed out waves.
ReplyDeleteThanks for including a photo of the no-diode harvester circuit. Good job.
ReplyDelete